Welcome to our exploration of Rail Info, a solution developed to enhance your understanding of the rail shipping industry’s critical data through insightful visualizations. The rail logistics experts at RSI Logistics designed Rail Info because they saw a need to understand the fundamental data of the rail industry; railroad data and government information that are otherwise delivered via raw numbers. These numbers can make it challenging to find trends, shifts, and movements, so we sat down and built models and visualizations to translate the data into insights that are uncomplicated and practical.
Whether you’re a rail shipper looking for areas of new business, a government official tracking industry trends, or a student studying the economics of rail freight, Rail Info offers the tools you need to stay informed and effective. Moving forward, we’ll explore the data sets available within Rail Info.
If you’re new to our services, we invite you to explore the benefits of Rail Info with a no-obligation, one-month trial. Sign up and empower your rail-related endeavors today.
Table of Contents
- Benefits of Rail Industry and Railroad Data
- Rail Industry Resources
Benefits of Rail Industry and Railroad Data
Exploring the rail industry data and analytics available in Rail Info can give you a better understanding of the market, help you plan your logistics more effectively, and find opportunities to save money.
- By leveraging insights from data such as rail rates, fuel costs, or the performance metrics of railroads, you can manage shipping expenses more effectively and optimize your supply chain’s strategies.
- Access to detailed analytics on rail shipping costs and performance against the industry can help you adapt to market trends, improve operational and business models, and manage price volatility risks.
- Understanding the geographical reach and capabilities of rail service providers allows for better market positioning. In addition, having detailed information on facilities and services helps in planning and executing logistics operations more efficiently.
- Visibility into major railroads’ performance metrics and benchmarking against industry standards offers insights into a railroad’s operational efficiency and financial stability.
- Establishing connections with railroads and service providers fosters favorable agreements and collaboration on logistical challenges.
Rail Industry and Railroad Data Resources
Resources for Optimizing Rates
Rail Info provides tools that translate data on rail rate analytics. These can be used to provide insights into fundamental aspects of rail shipping costs. From there you can also look for areas of optimization and possibilities for negotiation with the carriers.
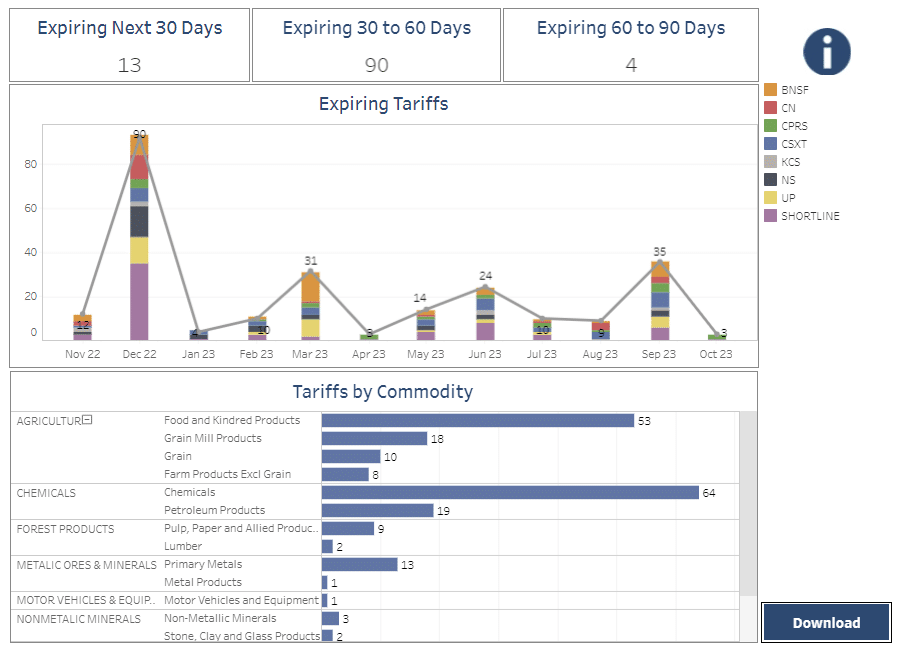
Tariff Expiration Calendar
Even though the railroads can adjust their tariffs with little notice, use this resource to give you an idea on when the railroads are expected to review their tariffs and make updates.
Fuel Surcharge Trends
Get an idea of how industry wide fuel prices are trending as well as a historical view on mileage based and percentage-based fuel surcharges.
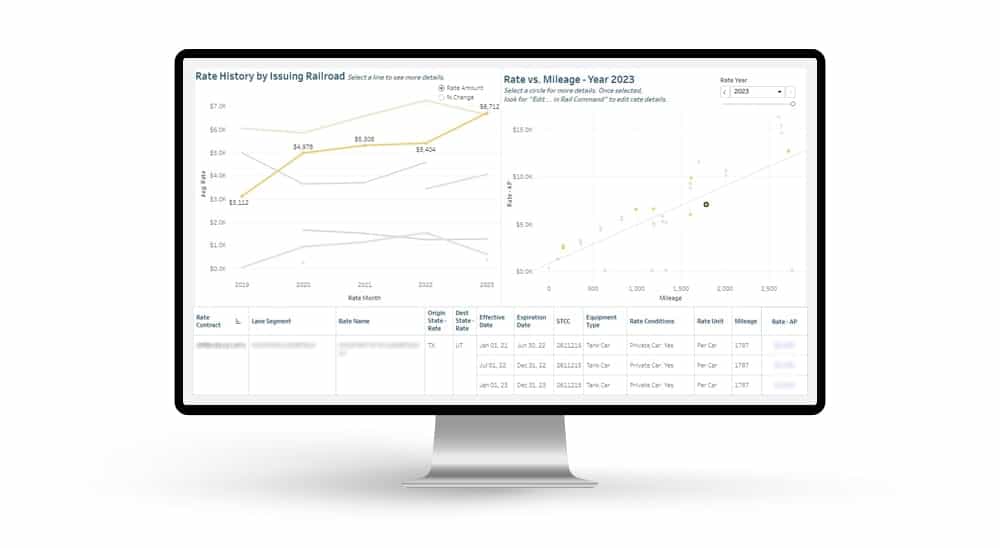
Tariff Change History
Using a sample size of public railroad tariffs, you can track rate changes and can view them from a historical, current, and tariff distribution perspective. Using this data can provide some insight into how your rates are performing against a benchmark.
Railroad Cost Indexes
The Rail Cost Adjustment Factor (RCAF) is an index formulated to represent changes in railroad costs incurred by the nation’s largest railroads and is a useful data point for understanding if rate increases by the rail carriers are reasonable. The RCAF measures the rate of inflation in railroad inputs and is comprised of seven component indexes: labor, fuel, materials and supplies, equipment rents, interest, depreciation, and other expenses.
Resources for Understanding Railroad Data Performance
Railroad Performance has dashboards that cover indicators of the Class I railroad’s performance. The largest rail carriers in North America are these Class Is, and they dominate the rail freight market. Using their reportable metrics, you can see the overall health of the rail network, find trends, and monitor performance.
Delay Report
Use the delay report to see how traffic is moving through classification yards. Insights here can help anticipate where your transit delays could happen. Use the report and filter the delay reports by railroad, trains, and railcars held to find where your traffic is being impacted.
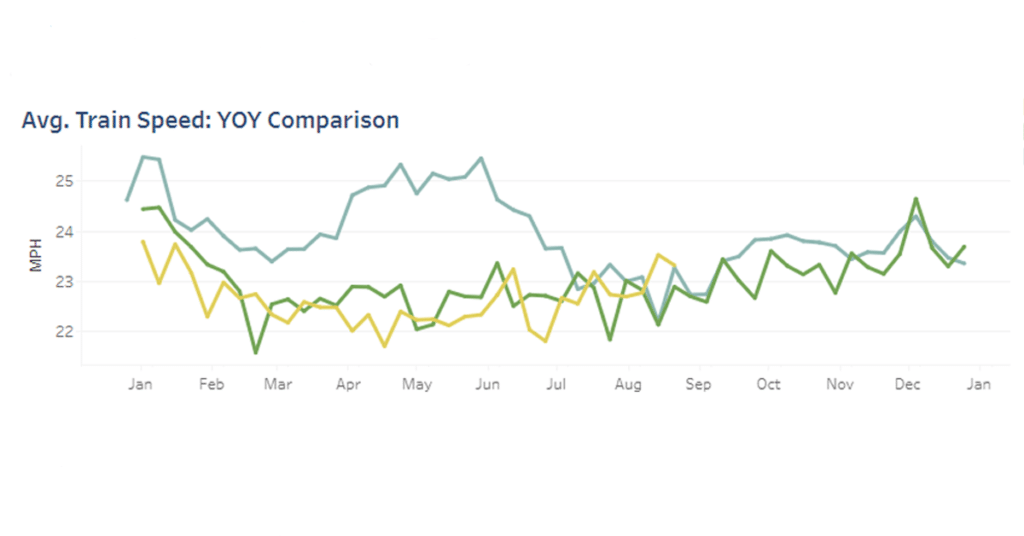
Velocity
Velocity is the speed of a train from origination to destination, including the amount of time a train dwells in a yard for a crew change, pick-up or set off of traffic. Try comparing the delay report to the velocity report. When velocity is up, dwell should be up as well.
Volume Reports
This report gives you a view of the total number of cars operational by Class I railroads and includes a historical view. Identify and monitor trends and determine how carriers are performing.
Curious to see how your volume compares to the industry? With the weekly carloads view you can find more approximate benchmarks.
Resources for Determining Options
Whether you’re a rail shipper or interested in the various options involved in rail shipping logistics, Rail Info’s Directories give you a wealth of information concerning options throughout the rail industry. You can use these to research options for your rail logistics or along the networks.
Serving Carrier Reciprocal Switch (SCRS)
This tool provides a standardized verification process for determining whether a railroad may serve, or under what conditions a railroad may serve, a specific customer. Our SCRS Directory also provides valuable weight and plate information for each customer.
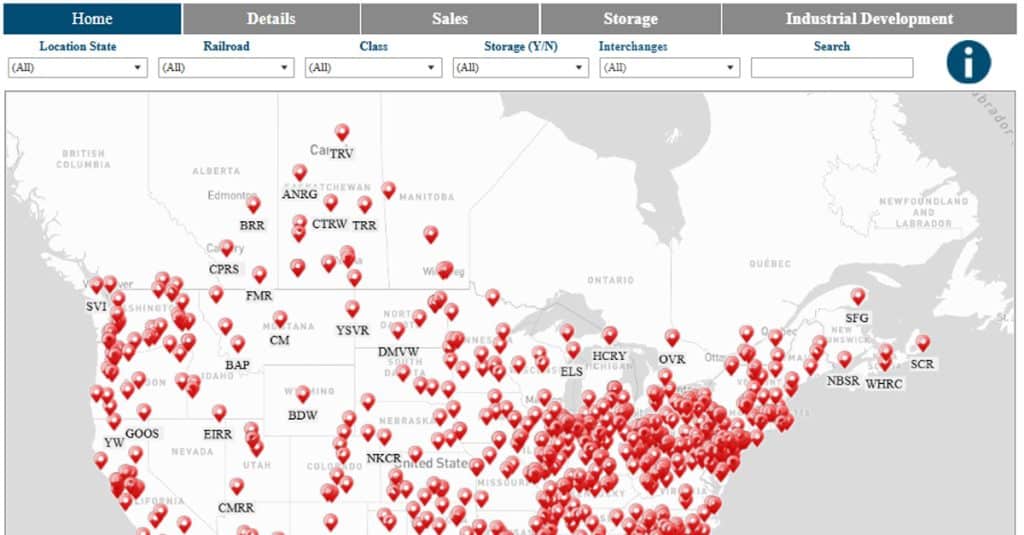
Short Line Railroad Directory
Use this interactive map to find information for Short Line Railroads, those railroads falling outside the Class I classification. Filter the list down to focus on a specific state and railroad. You can also use find details such as website links, as well as sales and industrial development contacts.
Storage Directory
The Storage Directory was developed to provide a map of car storage locations across Canada and the United States and allows you to research organizations with available locations in specific regions.
Transloading Terminal Directory
This directory provides a one stop shop to find a transload facility to meet your needs. This interactive map is composed of terminals throughout North America, including our RSI operated terminals.
You can learn more about RSI’s terminal operations here – Rail Terminal Services | Bulk Terminal – RSI Logistics
Resources for Measuring Economic Activity
This section provides a selection of resources and tools for measuring economic activity, enabling you to gain a deeper understanding of economic trends, performance metrics, and their implications on broader market dynamics.
Fuel History
In addition to our fuel surcharge resources, Fuel History breaks average fuel costs down by the Class I railroad and by yearly quarter.
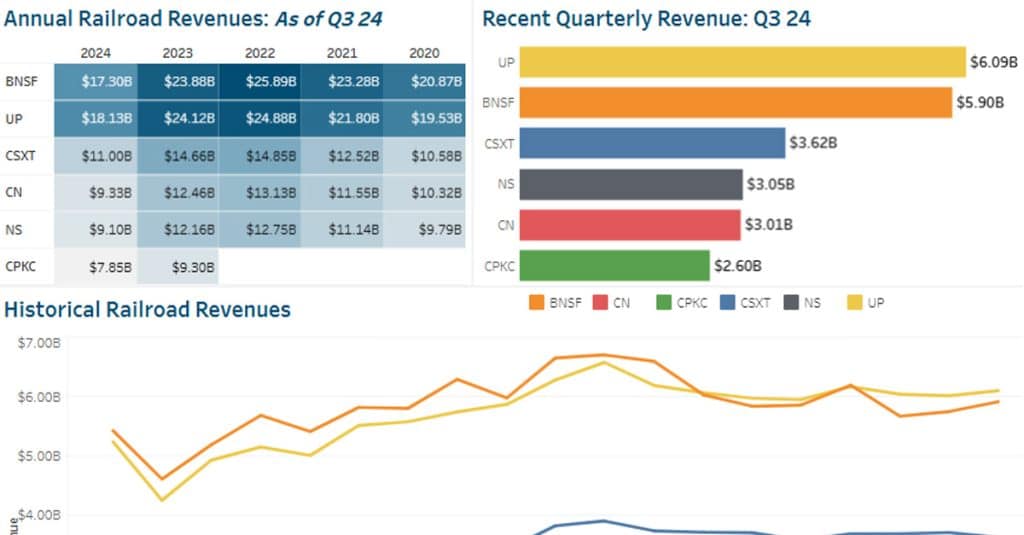
Railroad Revenue
With the Railroad Revenue dashboard, you can view revenue metrics for each of the largest Class I railroads.
Operating Ratio
Typically, the Operating Ratio (OR) is a primary measurement of a railroad’s efficiency. It can be defined as a company’s operating expenses as a percentage of its revenue. A lower Operating Ratio implies a more efficiently operated railroad.
Volume
This is a report to show the volume of shipments for each of the Class I Railroads and includes cars and intermodal units shipped. This is a higher-level view of volume than what can be seen in the volume reports under Railroad Performance and is an important measure for understanding how efficiently a railroad is utilizing its assets.
Fuel Surcharge Percent of Fuel Expense
This is another report to show the portion of fuel costs that are being recouped through the fuel surcharges being applied.
If you’re in the rail industry, related fields, or just interested in this mode of freight transportation, making the most of data analytics can be a game-changer. Mastering negotiation tactics, keeping a lid on costs, making smart choices based on data, and knowing your market positioning can put you ahead of the curve. And it’s not just about optimization—by utilizing these resources, you’re also set to build stronger partnerships and stay on the right side of policies and regulations.